


📊 Example: Tracking LRR Over Time
The beauty of this script is the ability to see how your ratio changes over time.
Below is an example of an LRR graph generated between June and November 2024, showing how efficiency evolves with campaign changes, new keyword tests, and optimization cycles.
If you spot sudden shifts, it’s usually a sign of something deeper, like a change in match types, automated recommendations, or adjustments to DSA targeting.

You can immediately spot trends that correlate with optimizations, tests, or major campaign changes.
💡 How to Use It in Audits
At Ad Hackers, we use the Lin Rodnitzky Ratio as part of our Google Ads audit framework.
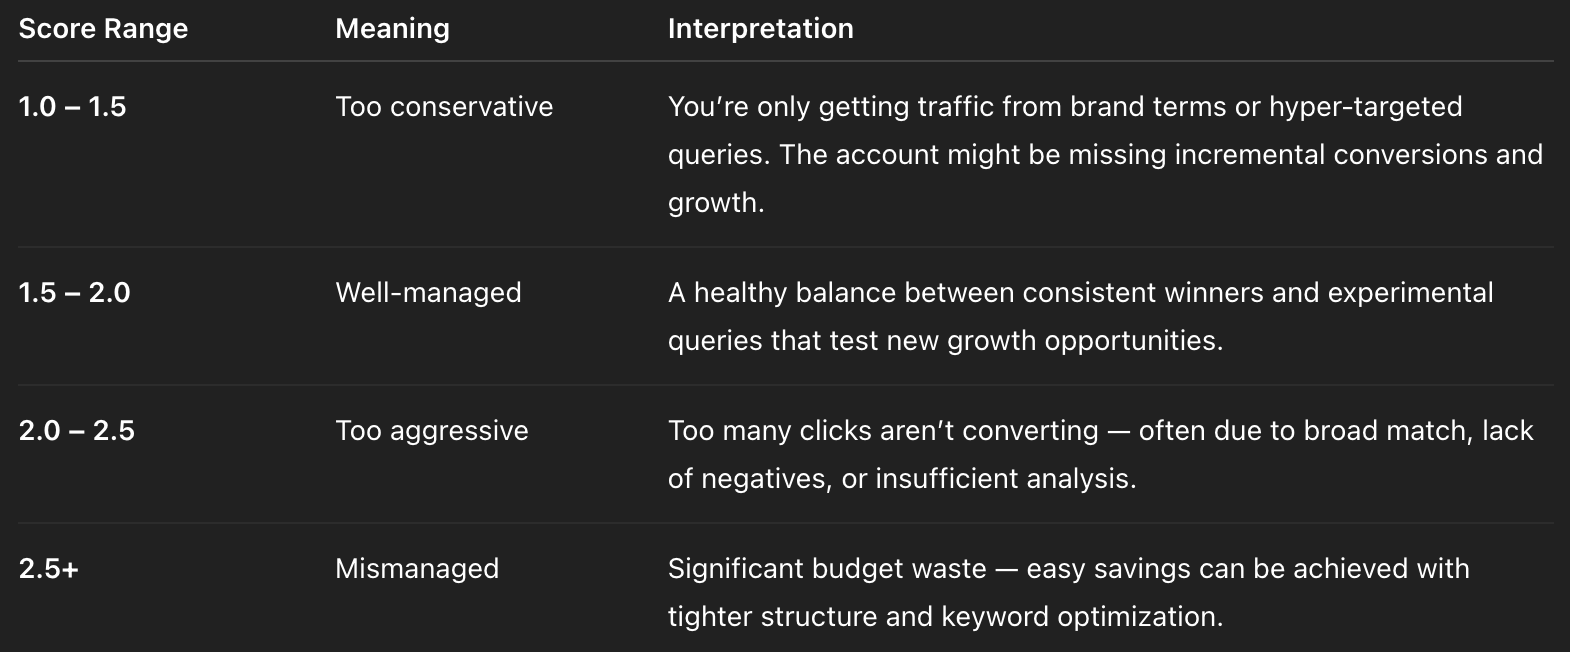
Here’s how we interpret and act on it:
- LRR > 2.5 (High ratio)
→ The account is overspending. Add negatives, reduce DSA budgets, or use tighter keyword match types.
Best for clients who prioritize short-term ROI. - LRR < 1.5 (Low ratio)
→ The account is too cautious. Expand with DSAs, test broader match types, and explore new segments.
Ideal for growth-oriented strategies. - Sudden changes
→ Investigate causes — e.g., if auto-applied recommendations added broad keywords, turn those off and regain control.
💡 Key Takeaways
- The Lin Rodnitzky Ratio condenses complex Google Ads data into one efficiency score.
- Ideal for fast audits, performance tracking, and reporting.
- Healthy range: 1.5–2.5 — adjust your strategy depending on whether you need growth or profitability.
- Use the free script by Nils Rooijmans to automate the tracking and visualize long-term efficiency.
🔗 Resources
- Google Ads Script – Lin Rodnitzky Ratio (by Nils Rooijmans)
- NilsRooijmans.com
- The Complete AdWords Audit – Part 11: The Lin Rodnitzky Ratio (BGTheory)
At Ad Hackers, we help performance-driven brands and agencies make smarter decisions with data.
Metrics like the Lin Rodnitzky Ratio help our clients understand not just where money goes — but how well it works.
Want to find your account’s efficiency score?
👉 Request a free audit